


This case study is part of the ESA GDA Transport & Infrastructure (T&I) consortium’s broader work to support International Financial Institution (IFI) teams with innovative, user-tailored Earth Observation (EO) services. Within the World Bank’s (WB) Uganda Secondary Education Expansion Project (USEEP), the objective is to enhance access to lower secondary education for underserved populations in targeted areas by constructing new schools, expanding existing ones, and ensuring the safety of children.
Overcoming education planning challenges in Uganda
Uganda faces significant school non-attendance rates: 25% among population aged 6–12 and 38% among those aged 13–18. In response, the USEEP was launched to address the pressing challenge of low secondary school attendance, with plans to construct 116 new schools and expand 61 existing ones.
The current site-selection protocol primarily relies on the social and economic characteristics of the population. While this information is essential for effective school planning, EO and geospatial analysis offer valuable complementary insights, particularly for understanding population distribution, accessibility, and school’s service areas. The collaboration between the WB and the ESA GDA T&I consortium explored these topics and challenges with the aim to support the USEEP through evidence-based school planning, offering a more detailed picture of the supply and demand for educational services. As part of this work, existing data gaps were also assessed, and multiple solutions explored to address them depending on planning requirements, decision-making needs, and the expected accuracy of results.
Determining where to build schools or provide alternative cost-effective educational services
The ESA GDA T&I consortium, specifically IABG and DLR, used geospatial and statistical information as well as EO data, applying geoprocessing and AI models to support decision process on where new schools should be built, where existing ones expanded, and where more cost-effective alternatives, such as school transport services, would be more suitable. The following EO Information Products (EOIPs) were developed to support the WB team and to outline the complementary insights provided by EO and geospatial analysis. To demonstrate the workflow and its benefits, two subcounties in northwestern Uganda, Apo and Romogi, were selected.
- World Settlement Footprint (WSF): Census data are used to describe the overall composition and distribution of a country’s population. Uganda conducted a comprehensive national census in 2024. However, these statistics are available only for higher level administrative units. By using the Sentinel-2 data timeline since 2016 and combining it with the census data, DLR generated datasets on settlement patterns and population distribution at pixel level. These layers provide a detailed local picture of population distribution and enable local estimation of population numbers, which are essential for determining more precise locations for school interventions. IABG evaluated the need for new school infrastructure or lower-cost alternatives such as school transport, by modelling the accessibility and defining service areas based on school capacity and the spatial distribution of pupils.
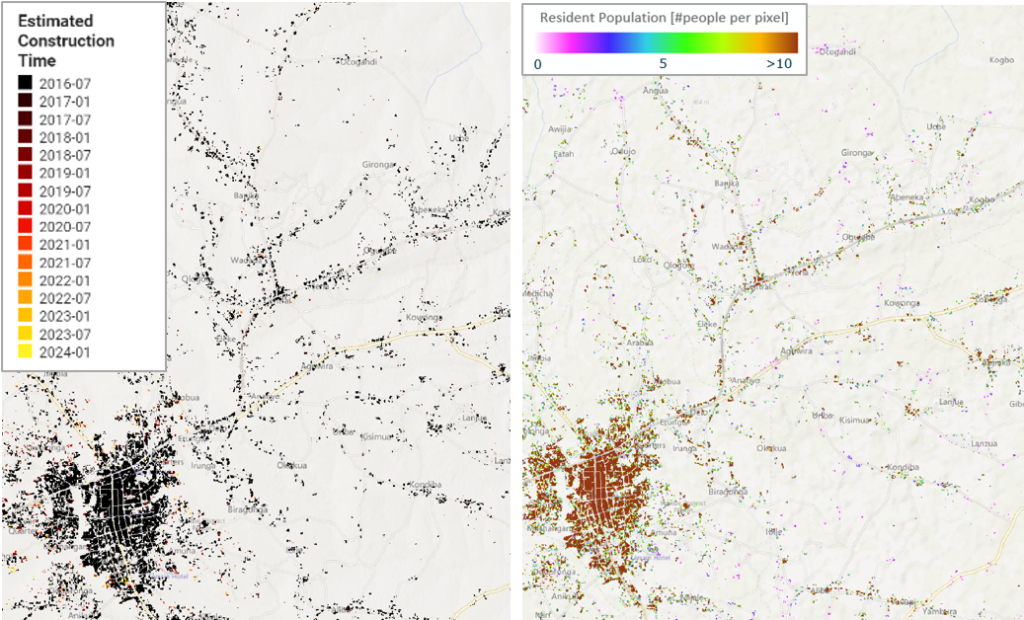
Figure 1: Left: Development of Settlement Extent over Time; Right: Population Distribution
- School deficit estimation: School surplus and deficit were estimated at the sub-county level using two methods: a general method based on census data only, and a specific method based on existing enrolment data. The latter were further used in the geospatial analysis, as they are considered more accurate for being based on empirical enrolment records for each sub-county.
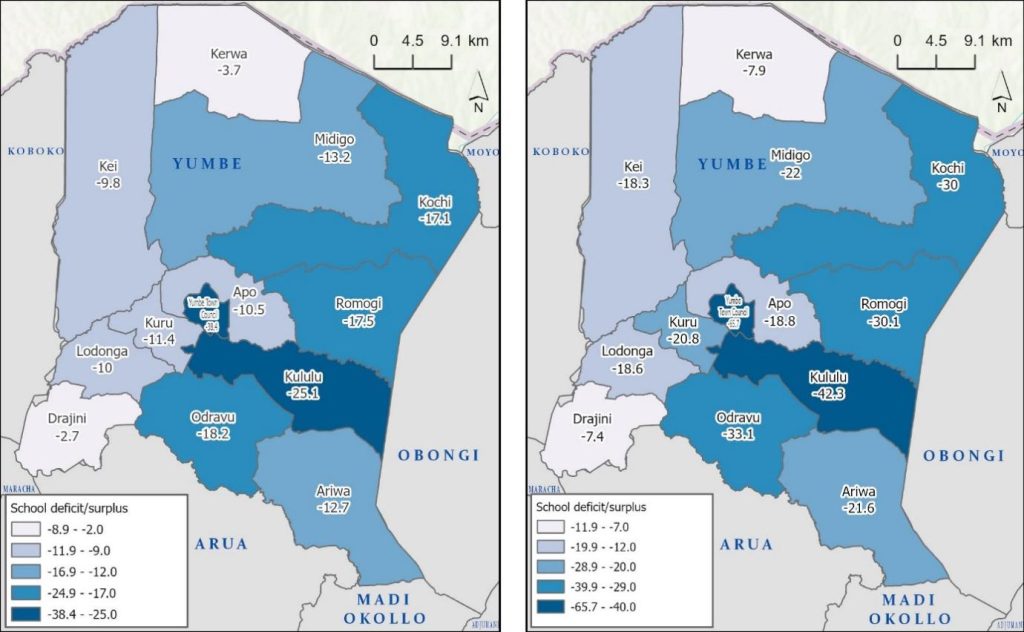
Figure 2: Left: Relative Primary School Surplus and Deficit by Sub-County. Right: Relative Secondary School Surplus and Deficit by Sub-County. Negative Values Represent Deficit, and Positive Surplus
- Accessibility analysis: Accessibility refers to how centrally located a school is in relation to the surrounding population. In Uganda, approximately 50% of journeys are made using non-motorised transport. The recommended maximum walking distance is 2 to 3 km for younger, primary school pupils, and 5 km (around 1 hour of walking) for secondary school pupils. To assess accessibility, the travel time from each location to the nearest school was estimated using input layers such as transport networks, land cover, and terrain. Combined with the WSF, this analysis helps answer questions such as “How many pupils must travel long distances, and where are they located”. The results provides a first detailed picture of potential gaps in school infrastructure and indicate where alternative solutions may be required.
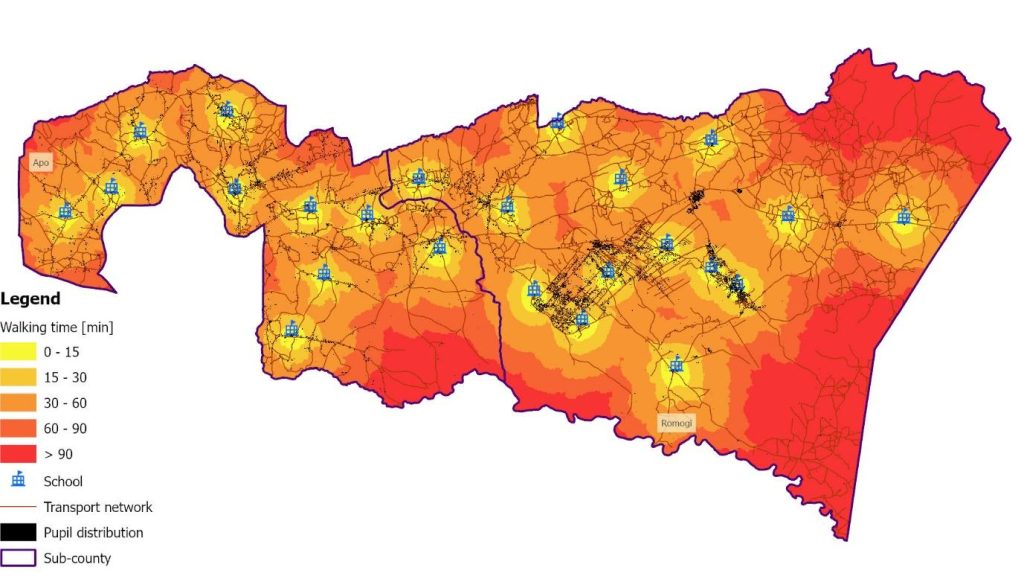
Figure 3: Travel Time to Schools in Combination with the Local Population Information from the WSF
- Catchment of influence: While a statistical deficit analysis determines the overall need within an administrative unit, the accessibility analysis provides an initial view of potential areas for intervention. Although the WSF considers local population distribution, it does not include the school structure information such as enrolment data. The catchment of influence, based on the school capacity, defines the area each school can serve. These areas were calculated using enrolment data (or current school capacity) for each school together with a gridded dataset of pupil distribution values. Combined with the other EO products, this analysis helps answer questions such as: “What is the effective catchment area of each school based on its capacity and which areas remain underserved?”
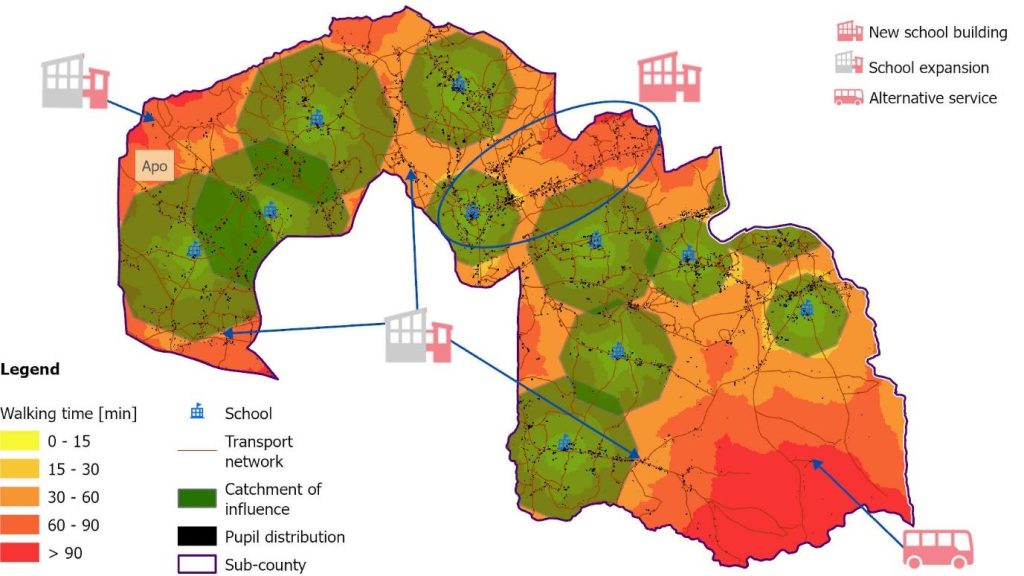
Figure 4: School Capacity Polygons Overlaying Walking Travel Time Map, Sub-County of Apo
While the accessibility model identifies how far pupils live from the nearest school, the service areas delineate the catchment zones and the corresponding demand each school can accommodate based on its capacity. This combined approach provides a comprehensive view of the supply and demand for education infrastructure, ultimately guiding evidence-based decisions on the type and location of educational services needed.
The advantage of using a population and pupil distribution dataset over generic statistics or census data lies in its spatial disaggregation. This allows for more detailed and targeted accessibility and serviceability analysis, helping to identify patterns and pinpoint underserved areas.
Leveraging EO data for evidence-based planning of educational services in Africa
The EO products and workflow are expected to serve as a proof of concept for the integration into the USEEP project. In the first phase of the WB project, 60 school sites have already been selected. The workflow developed under ESA GDA can be applied as a complementary evaluation to assess the impact of these planned new buildings. For the additional 56 schools and planned expansions, the methodology can be integrated into the site selection process to ensure that chosen sites are accessible and serve the maximum possible number of pupils.
Replicability and scalability were also central topics during discussions with the WB. The aim is to enable uptake of the developed approach by the Ugandan government and extend its application to other African countries, as well as to other thematic areas such as healthcare facilities. The main challenge to replicability and scalability is the availability, quality and consistency of data. Building a baseline dataset required exploring alternative solutions to address these challenges with varying levels of effort. To manage such constraints, approaches of differing levels of detail were developed, making the methodology less vulnerable in cases where only higher-level statistics are available.
In the next phase of the cooperation with the WB team, the analysis will be extended to include a climate vulnerability analysis and potential threats to the educational infrastructure. This will further refine the planning and site selection phase and allow relevant mitigation and protection measures to be identified. It will further support the USEEP and its commitment to provide a safe and resilient educational environment.
This activity is still ongoing, and while initial EO results have been delivered, there are no confirmed updates yet on their uptake by the World Bank team. Uptake will be revisited and reported once the engagement progresses further.