


Heat stress in a fast-growing West African metropolis
Abidjan is expanding rapidly, driven by strong economic growth and continuous population inflows. Much of this growth has been unplanned, with dense built-up areas spreading at the expense of natural green spaces. Combined with rising temperatures linked to climate change, this urban expansion has intensified heat stress across the city, particularly in densely populated neighbourhoods where outdoor exposure is high and adaptive capacity is limited. These conditions affect everyday life, increasing health risks, reducing outdoor comfort, and placing additional pressure on energy systems.
Urban heat compounds other environmental challenges already facing Abidjan, including poor waste management, inadequate drainage, and hazardous land use. These factors reinforce existing vulnerabilities and make climate risks more acute, especially for low-income communities. In this context, understanding where heat accumulates, how it varies within the city, and which areas are most affected is essential for effective urban planning and climate adaptation.
Building on the World Bank–funded Community Mapping and Nature-Based Solutions project, this case study supports the operationalisation of a Surface Urban Heat Island Intensity service for Abidjan. By combining satellite-based temperature data with street-level measurements, it provides targeted, decision-ready insights to inform cooling strategies, nature-based solutions, and climate-resilient urban planning.
Ground-level data collection to capture Abidjan’s urban microclimate
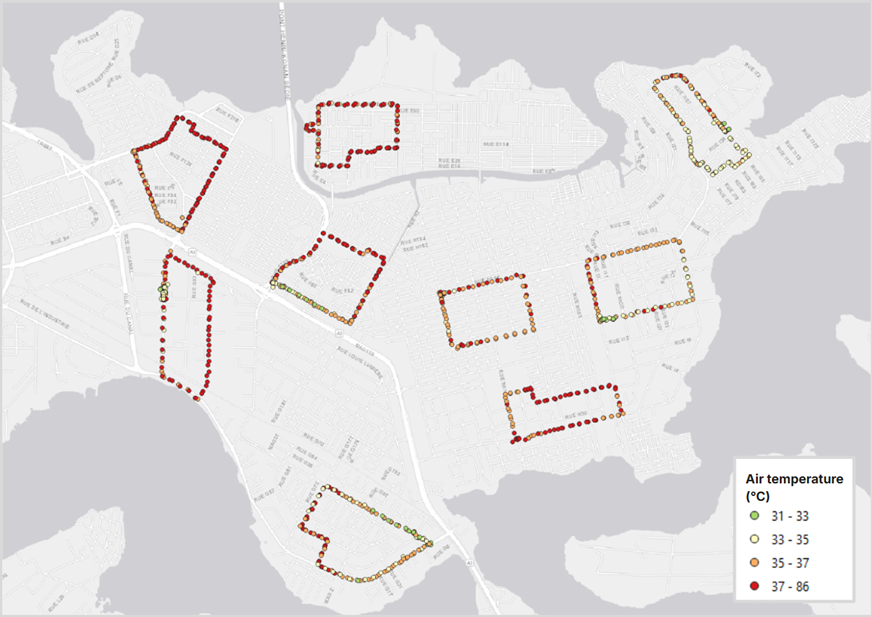
To ground satellite-based heat analysis in local conditions, the work in Abidjan builds on an extensive in-situ measurement campaign conducted by MindEarth in 2024, in partnership with OpenStreetMap Côte d’Ivoire, UrbaPlan, and Sepia Conseils. This earlier phase focused on generating reliable, street-level environmental data through a combination of community-based cartography and IoT-enabled sensing. Using the MindEarth mobile app, local participants collected geotagged street-level imagery documenting vegetation, waste, and urban conditions. All images were processed to ensure GDPR compliance through the automatic blurring of faces and vehicle license plates. In parallel, wearable Atmotube Pro sensors captured high-frequency measurements of ambient temperature, humidity, pressure, and air quality, including particulate matter and volatile organic compounds. Together, these bottom-up datasets provide a granular picture of Abidjan’s microclimate and urban environment, creating a strong empirical foundation to validate, calibrate, and refine EO-based urban heat mapping in the current phase of the work.

The UMAP analysis for Abidjan opens with a Surface Urban Heat Island map that clearly highlights where the city experiences the highest temperatures. The hottest hotspots align closely with the most densely built and populated areas, where impervious surfaces dominate and vegetation is scarce. This city-wide view immediately shows how heat is not evenly distributed, but concentrated in specific neighbourhoods.
When zooming in and adjusting the map layers, a clearer pattern emerges: many of the most intense heat hotspots overlap with informal settlements. These areas are characterised by high building density, limited access to green space, and construction materials that retain heat throughout the day. The following animation shows just that.
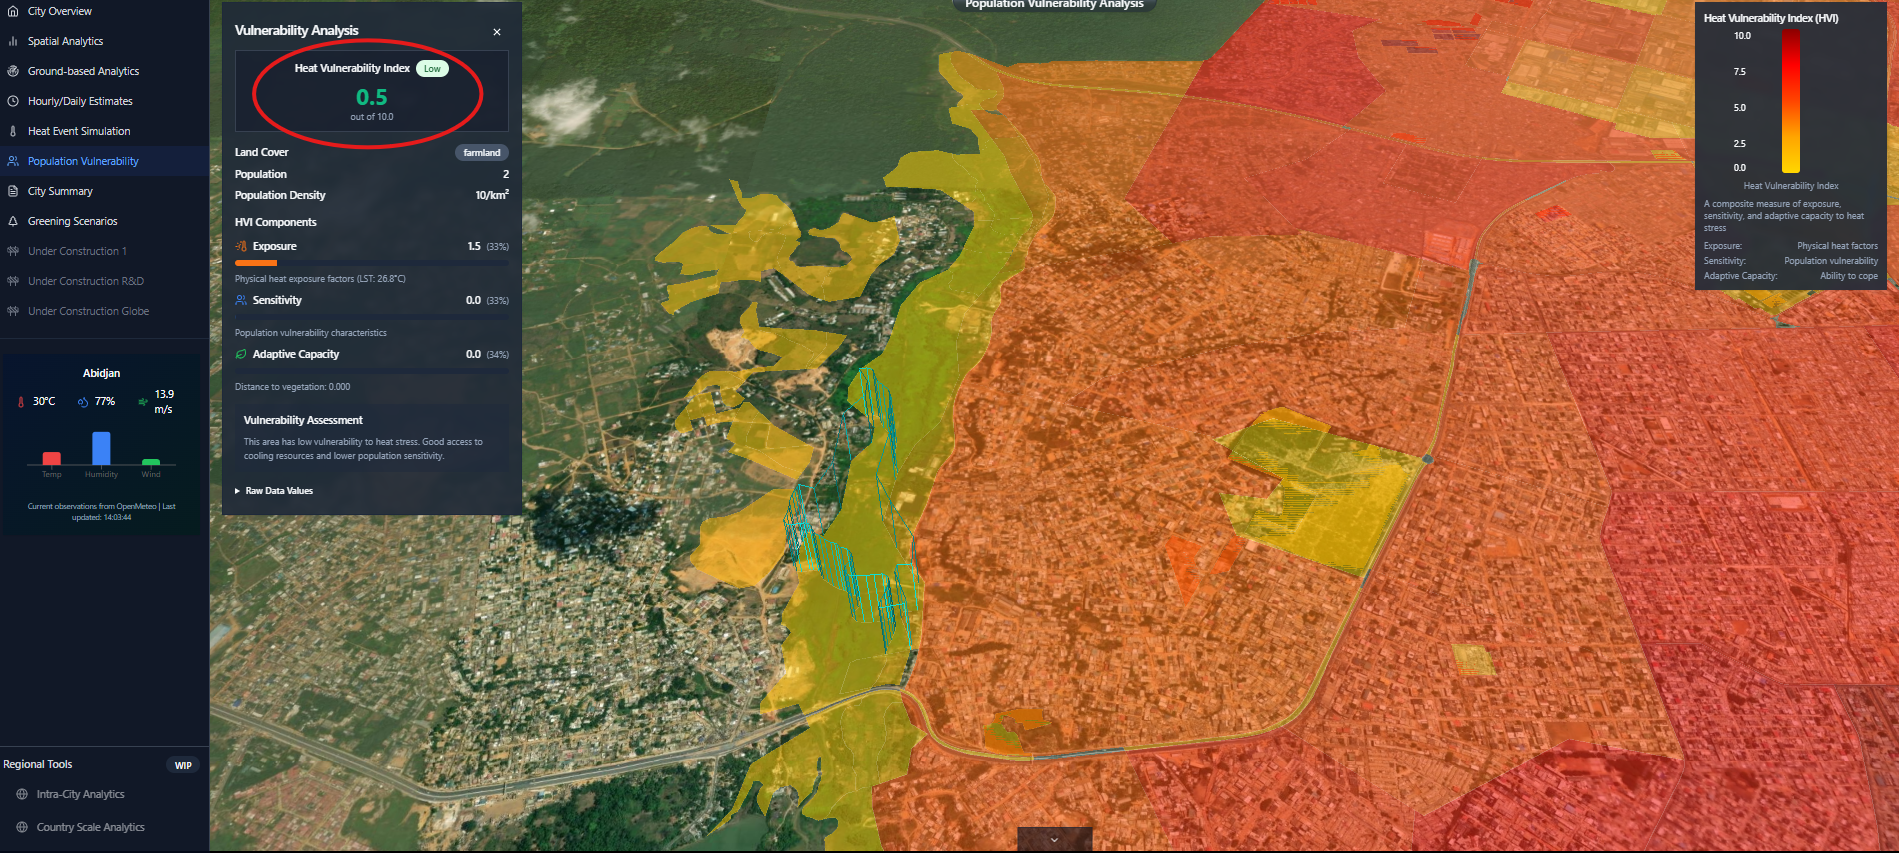
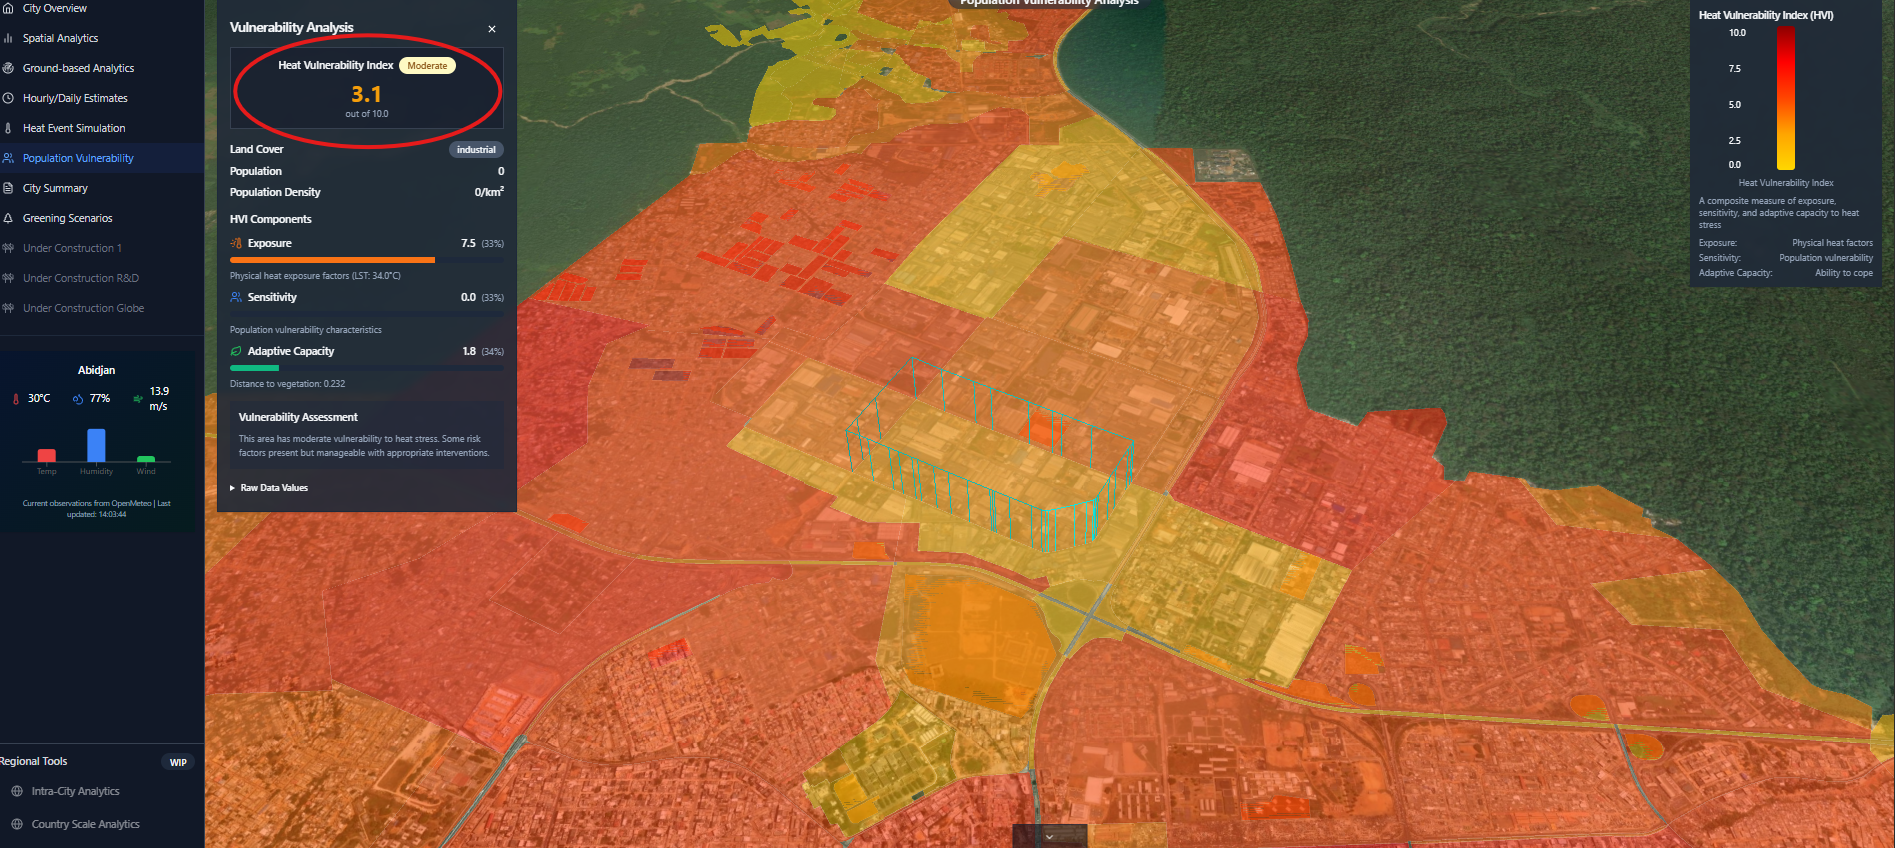
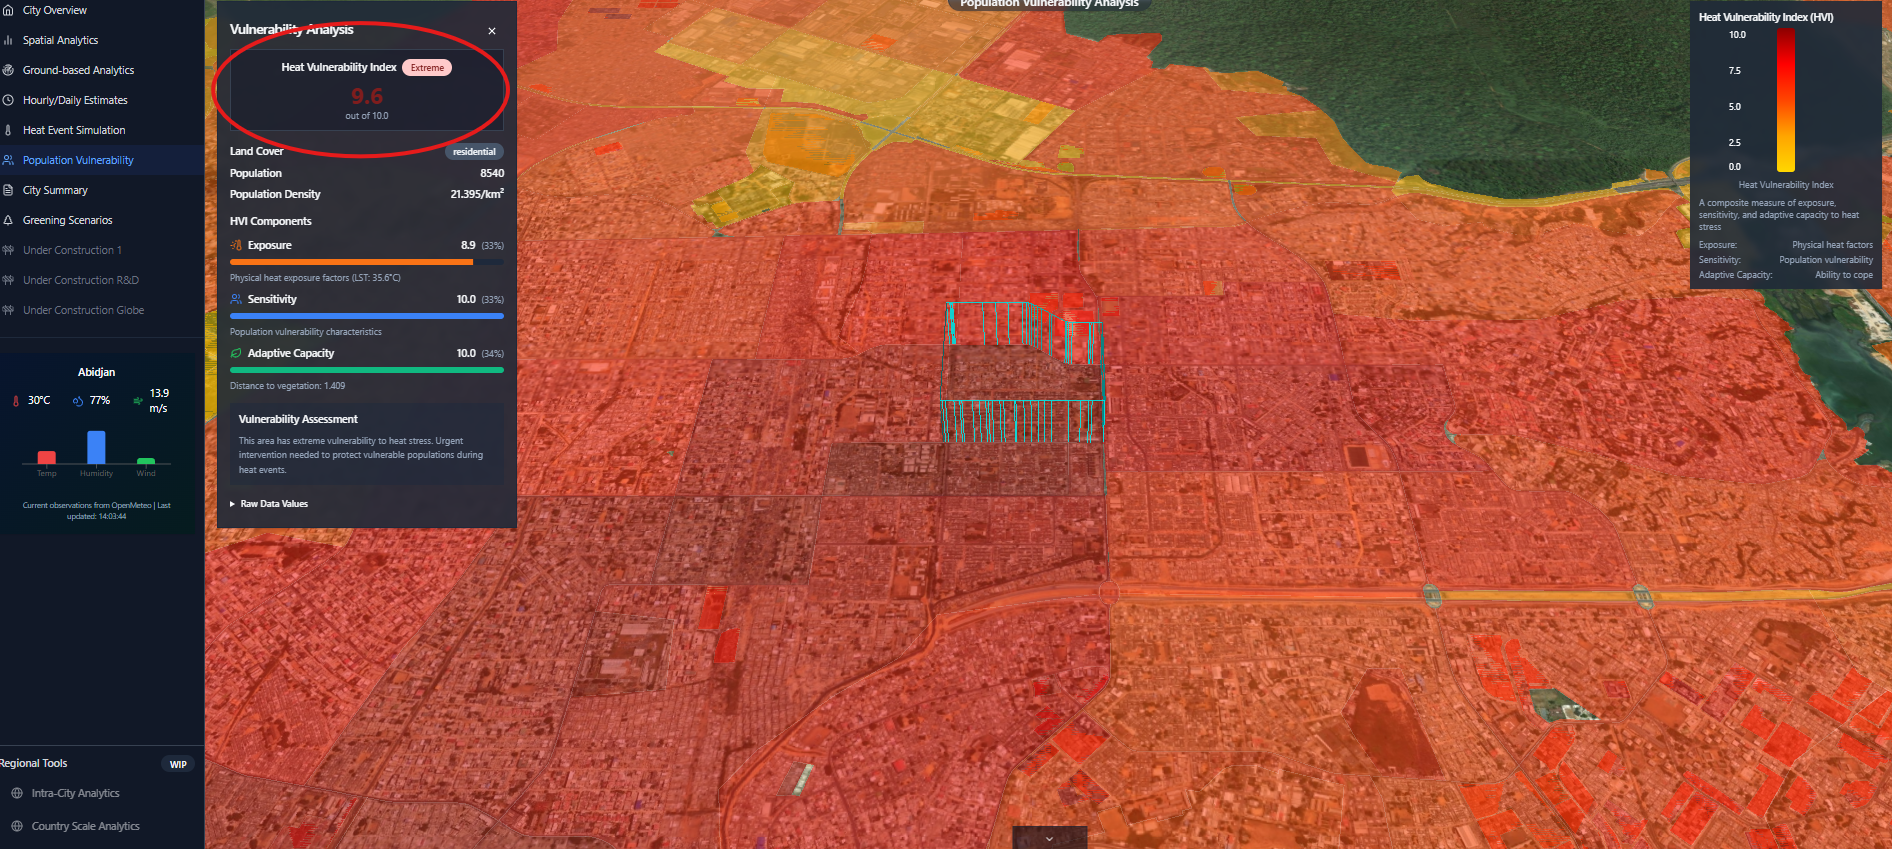
Beyond heat intensity alone, UMAP enables a deeper understanding of who is most exposed to heat through a Heat Vulnerability Index (HVI). For Abidjan, this analysis is particularly revealing. The HVI combines three key dimensions: exposure to urban heat derived from land surface temperature (Exposure Weight), population density as a proxy for sensitivity (Sensitivity Weight), and distance to green spaces as an indicator of coping capacity (adaptive Capacity Weight). Together, these factors highlight neighbourhoods where high temperatures intersect with dense populations and limited access to cooling environments.
The resulting maps show a strong spatial overlap between high vulnerability scores and large informal settlements. In these areas, densely packed housing, heat-retaining construction materials, and distance from green or shaded spaces significantly increase heat-related risks. By allowing users to explore individual parcels and adjust the relative importance of each component, the HVI framework remains transparent and adaptable to local priorities. This modular approach helps translate complex data into actionable insights, supporting more equitable discussions on where heat adaptation measures are most urgently needed and where interventions could deliver the greatest social benefit.
From local insights to scalable urban heat solutions
By combining Earth Observation data with detailed ground-level measurements, the Abidjan case study shows how urban heat risks can be translated into decision-ready evidence. Through tools such as UMAP, heat hotspots and vulnerability patterns become visible at the scale where planning and investment decisions are made. Importantly, the approach developed in Abidjan is not city-specific: it demonstrates a transferable methodology that can be applied across other rapidly growing cities facing similar challenges, supporting development partners and local authorities in designing targeted, equitable, and scalable urban heat resilience strategies.