


Earth observation is emerging as a key resource for development finance. In Madagascar, it gives the German Development Bank KfW (Kreditanstalt für Wiederaufbau) a clearer view of where anti-erosion measures are working, where pressures persist and how the Programme de Lutte Anti-Erosive can continue to improve. Through the European Space Agency Global Development Assistance programme’s Fast Earth Observation Co-Financing Facility, partners are demonstrating how satellite based monitoring can support planning and informed decisions for national institutions and international funders alike.
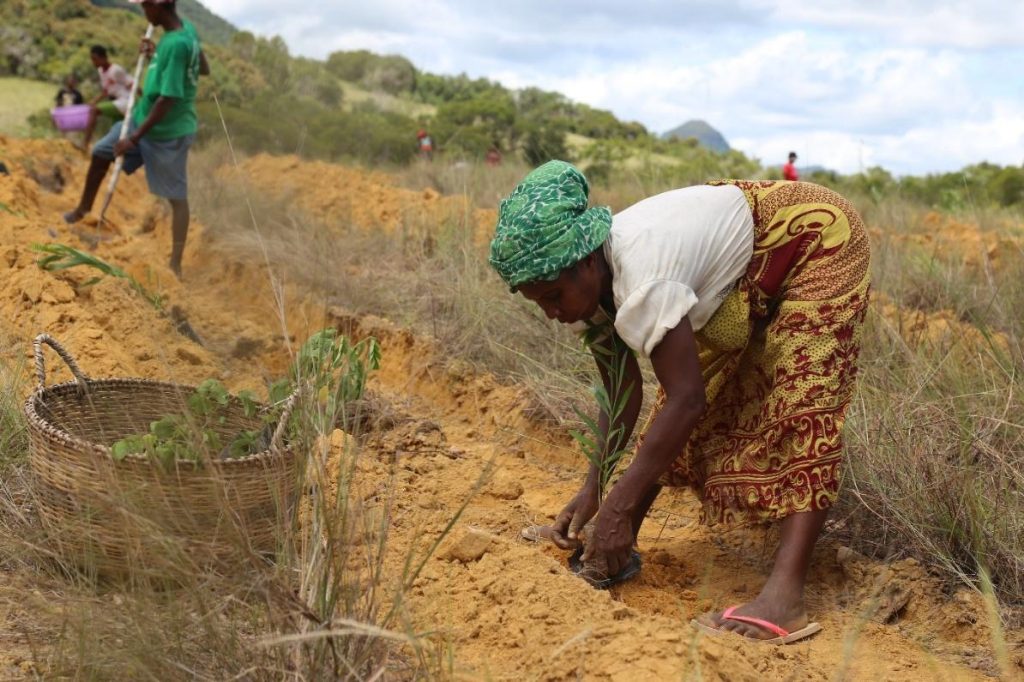
Madagascar’s environmental pressures make this support increasingly important. Decades of deforestation, driven by the demand for charcoal and fuelwood, have removed nearly half of the island’s natural forests since the 1950s. Around 46 percent of the land now shows signs of soil degradation. The island is also one of the world’s most fire affected regions, with 21 to 25 percent of its land burning every year. EO provides an efficient way to monitor these changes at scale and to assess how reforestation programmes respond to them.
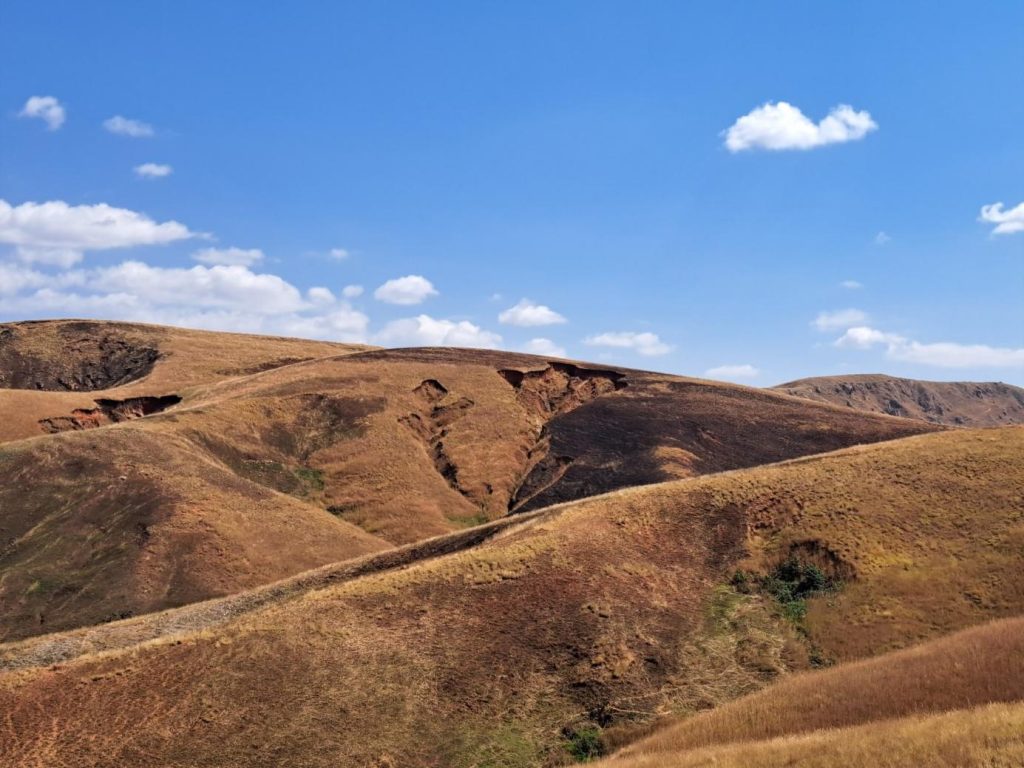
Burnt areas and some erosion in the landscape in Madagascar. Photo Credits: Paul Thielmann (KfW)
Programme context and partnership
Numerous initiatives have been launched to counter deforestation and promote reforestation across Madagascar. One of the flagship efforts is the Programme de Lutte Anti-Érosive (PLAE), financed by the German Federal Ministry for Economic Cooperation and Development (BMZ)through KfW and implemented by the Malagasy Ministry of Agriculture and Livestock as part of the German Malagasy Environment Programme (PGM E).
While PLAE has already supported substantial reforestation and restoration activities, its long-term effectiveness varies and requires continuous monitoring. Traditional field-based approaches alone cannot easily provide the spatial coverage or frequency needed to follow such a large programme.
To address this challenge, ESA, KfW, the PLAE project team and Malagasy stakeholders collaborated under GDA FFF to demonstrate how EO can complement existing monitoring structures. By integrating satellite based analysis into the programme, partners can track landscape dynamics more consistently and gain a clearer understanding of where interventions are succeeding or where additional support may be needed.
EO application
The collaboration focused on demonstrating practical EO products and methods that can support PLAE across three areas:
- Fire protection through Service 1 “past and current fire detection”
- Reforestation monitoring through Service 2 “monitoring tool for reforestation efforts”
- Forest biomass assessment through Service 3 “biomass estimation”
These services were developed together with national and programme partners to ensure usability and relevance for ongoing operations.
Past and current fire detection
Using a time series of Sentinel-2 high resolution imagery, this service analysed fire activity across seven regions (Diana, Sofia, Boeny, Betsiboka, Amoron’i Mania, Haute Matsiatra and Ihorombe) for 2023 and 2024.
Approximately 25,000 km² of burnt land were mapped in 2023, increasing to over 30,000 km² in 2024, with notable rises in the regions of Betsiboka, Boeny and Sofia. Fires followed clear seasonal and altitudinal patterns, with lowland areas burning earlier in the year and upland regions later. At the commune level, the spatial distribution of fire remained largely consistent, though intensity increased in 2024.
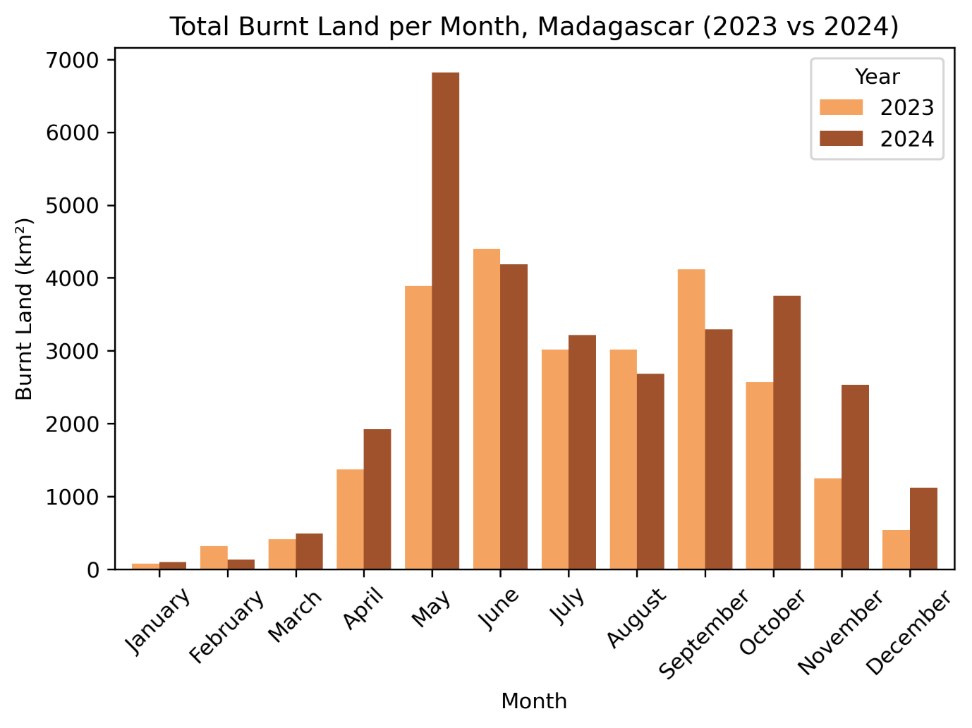
Total burnt areas per month and year, in the regions of interest
The analysis also supported reforestation monitoring. Of 459 reforested plots assessed, 183 were affected by fire over the two years. Importantly, EO comparisons showed that reforested plots were generally less impacted than surrounding areas, suggesting a positive influence of PLAE interventions in reducing vulnerability.
Detected Burnt Areas 2024
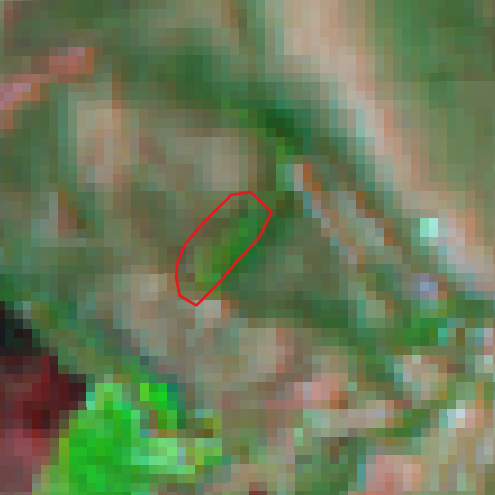
Sentinel-2 image acquired on 16/07/2024
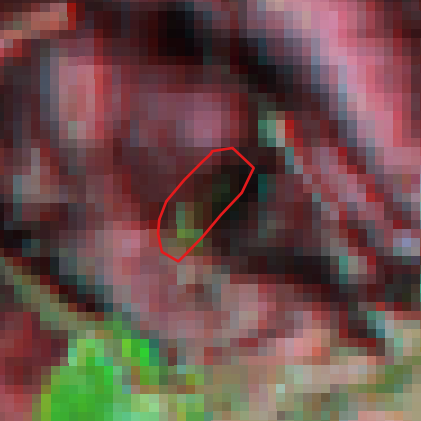
The brown areas that were previously green are newly burnt area
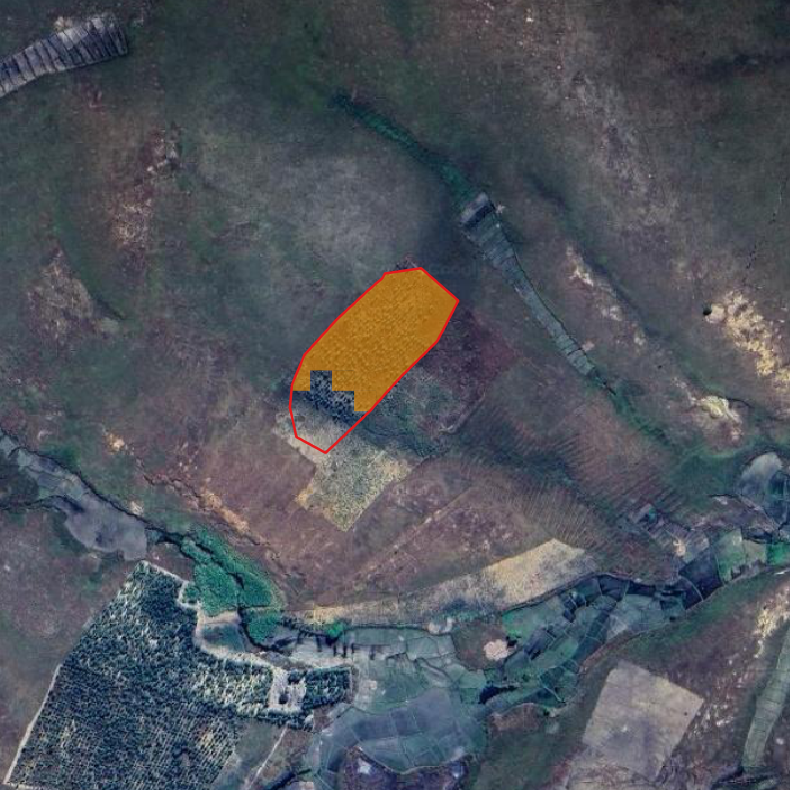
Example of impacted plot in 2024 – with the plot contours provided in red, the burnt areas in orange solid fill and the before and after Sentinel-2 images showing the evolution of the situation.
By leveraging the geographic and temporal coverage of Sentinel 2, this service offers a reproducible approach for understanding wildfire dynamics at regional scale. It also demonstrates how EO can be linked with programme monitoring to identify risks earlier and strengthen fire prevention strategies.
Monitoring tool for reforestation efforts
This service evaluated more than 550 reforestation plots using Sentinel-2 imagery from 2019 to 2024.
Planting activities of a communal PLAE forest in Maherivaratra, district of Ambanja, Diana region. Photo credits: Nofimamy RALAMBONIAKANGA from the PLAE team.
Several indicators were developed to describe vegetation evolution and assess plantation outcomes. A simple visual time series allows users to follow changes from 2019 to 2024, revealing different vegetation patterns across plots.
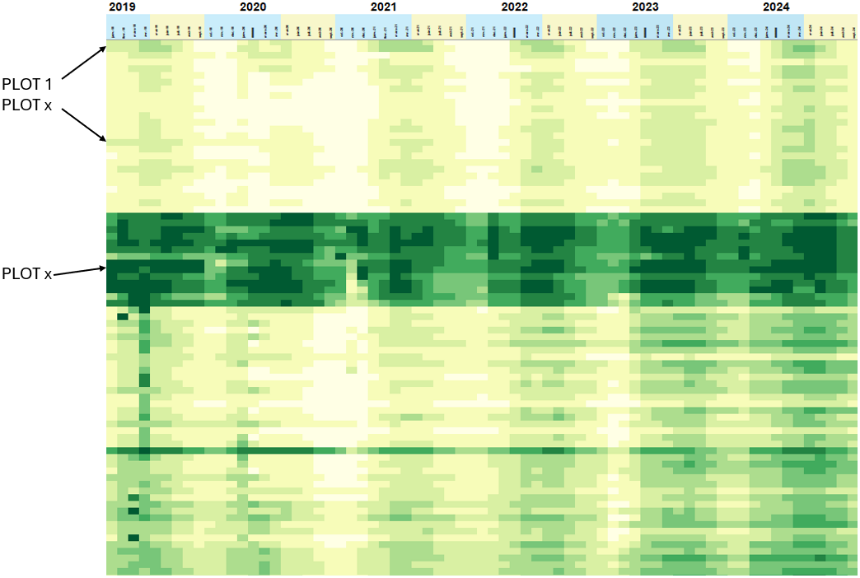
Green stretch of colours representing the density of vegetation in the studied plots (one line = one plot) as a function of the years (from left to right, from 2019 to 2024).
A tree growth indicator classified plots into five categories, ranging from no visible reforestation or unsuccessful effort to high tree growth. Results showed that 43 percent of plots demonstrated measurable vegetation recovery, while 46.2 percent showed no detectable growth, either because replanting was unsuccessful or because dense vegetation already existed before planting. These outcomes reflect the ecological realities of the regions, including slow growth rates and variable soil conditions.
A clustering analysis grouped plots into nine distinct vegetation patterns, revealing spatial and temporal growth trajectories. Regions like Ihorombe and Diana showed higher success rates, while Betsiboka and Boeny recorded more underperforming plots.
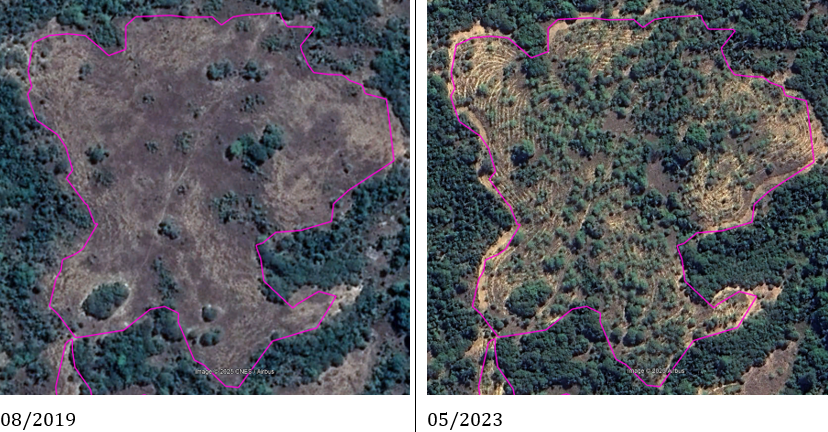
Pink: boundary of a reforestation plot, background: Google Earth imagery
A disturbance indicator identified possible events—such as fire, disease, storms or land conversion, that may have affected reforestation efforts between 2019 and 2024. In total, 398 plots showed signs of potential disturbance. While the EO results are valuable, a deeper interpretation would benefit from additional field data on species, planting density, survival rates and local conditions.
Overall, the tool provides a scalable and cost effective EO based framework for reforestation monitoring. It supports adaptive management and helps stakeholders identify where further attention or investigation is needed.
Biomass estimate
This service developed estimates of above ground biomass (AGB) across over 3,000 reforested plantations to support monitoring and carbon assessments.

White lines mark district boundaries; turquoise areas indicate the location of all forest plantations in northern Madagascar. Using satellite imagery, the service provides spatially detailed estimates of biomass, offering new insight into how young plantations are developing over time.
To achieve this, the analysis combines information from multiple satellite sources, each contributing a different perspective on forest structure and growth. Very high-resolution (VHR) imagery acquired at a single point in time (05/2021) makes it possible to identify individual tree crowns, while frequent PlanetScope observations capture how vegetation develops and changes across the landscape from year to year (2021-2024). These data are complemented by spaceborne LiDAR measurements, which provide information on estimated canopy height.
By detecting individual trees from space using a convolutional neural network (CNN) model, the service moves beyond traditional “forest vs. non-forest” mapping. It allows plantation structure and stand density to be tracked over time and turns tree growth into a consistent biomass indicator expressed per unit area (m3 per hectare), making results directly comparable across thousands of plantations.

Sample output showing individual tree crown delineation and biomass mapping based on VHR WorldView-3 imagery (2021)
The accuracy of the tree detection was carefully evaluated using geometric and detection based metrics, confirming that individual tree crowns could be reliably identified from the imagery. Based on the detected trees, key size characteristics were used to estimate plantation biomass in a consistent way across plantations.
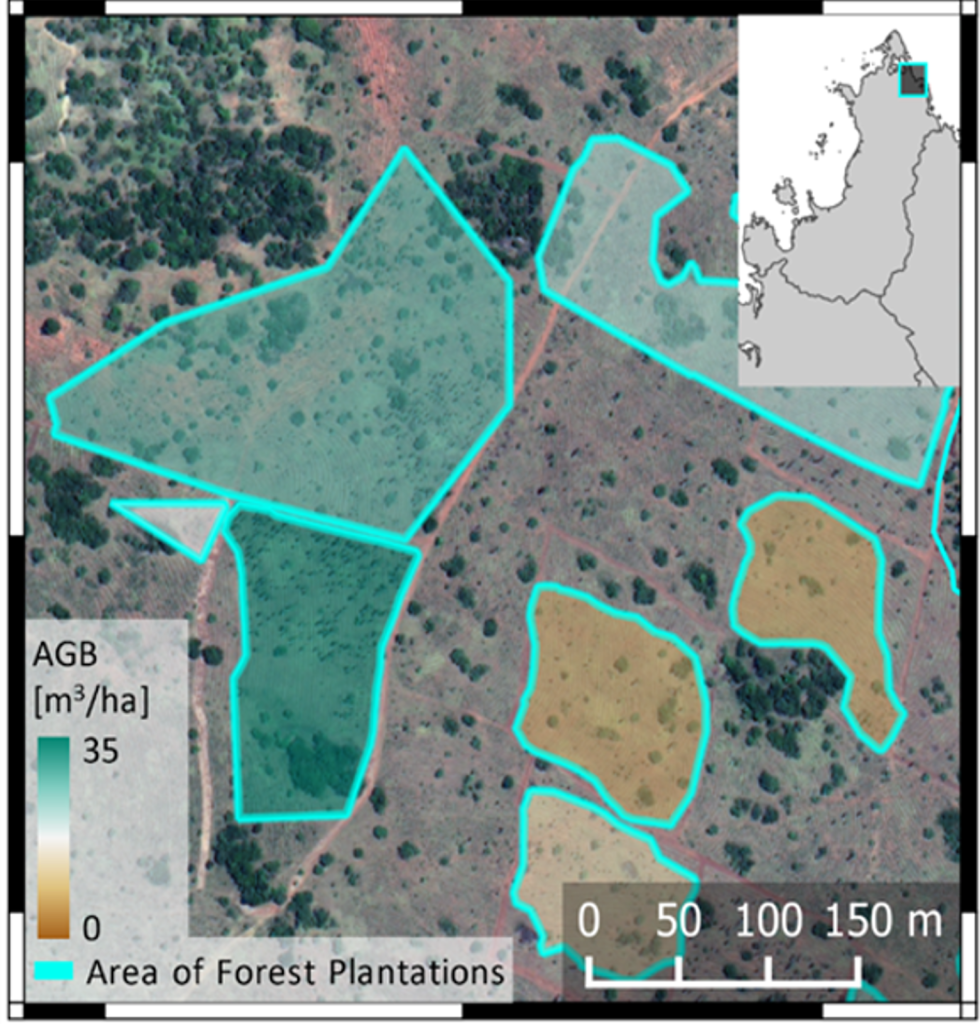
Predicted overall AGB in m³/ha for a sample plantation block in the Diana district via allometric model. Turquoise outlines represent the extent of forest plantations. (Base map: WorldView-3 image (05/2021).
PlanetScope time series from 2021 to 2024 revealed overall biomass increases of 10–30 m³/ha across most plantations. A smaller group of plantations experienced biomass loss (–10 to –40 m³/ha), potentially due to disturbances, harvesting or limited canopy closure. These trends were consistent with forest expansion patterns visible in the data.
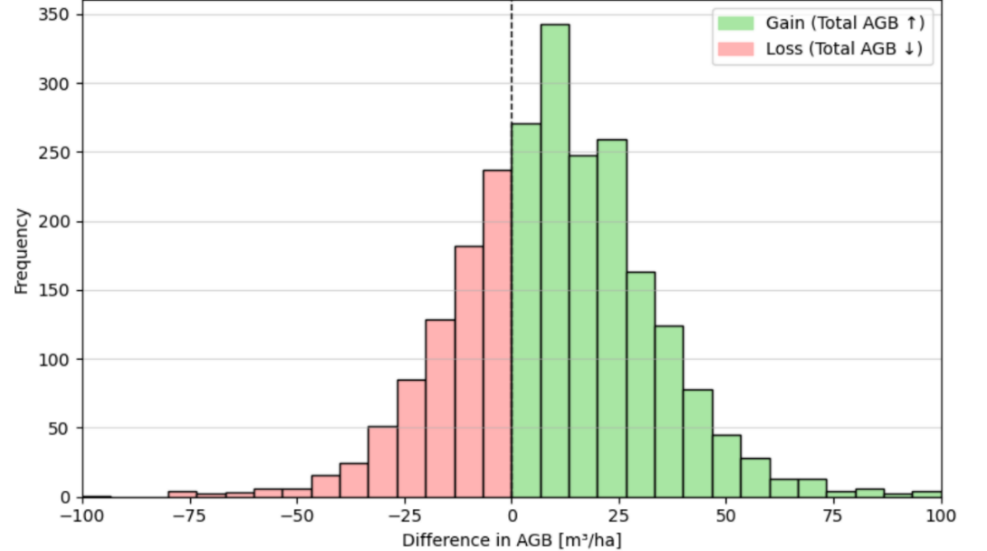
Distribution of plantation-level differences in predicted aboveground biomass (AGB, m³/ha) between 2021 and 2024. Positive values (green) represent biomass gain, while negative values (red) indicate biomass loss.
To add a structural dimension, a canopy height model was generated by combining GEDI LiDAR measurements with NICFI mosaics and information on elevation and slope. Predicted heights ranged from 4 to 19 metres, indicating young to mid-growth stages and helping users identify internal variability within plantations.

(a) RGB imagery of the example plantation with total height reference (7 m); (b) EO-based prediction of canopy height (0–7 m) for the same plantation in 2021, where darker green tones indicate taller vegetation. (Base map: WorldView-3 image (May 2021).
By integrating EO data from different spatial resolutions and time periods, the workflow enables plantation-level biomass estimates to be derived consistently across the study area. Although additional field data would enhance calibration, the service already supports operational forest management.
Overall, the service provides a robust multi resolution framework for biomass monitoring that strengthens decision making on reforestation progress and long term plantation dynamics. It is suitable for operational forest management and climate finance planning, offering a scalable foundation for continued monitoring.
Stakeholder engagement
The project was co-designed and validated through close collaboration with KfW, representatives from the partner ministry and implementation consultants. Regular consultations ensured that the EO services addressed real operational needs and could be integrated into existing workflows.
KfW representatives emphasised how EO analysis provides important early indications of project effectiveness and offers new opportunities to improve future monitoring cycles. They highlighted the potential of EO to detect risks earlier, strengthen programme planning and support evidence based decision making.
As Juliana Trappmann, Portfolio Manager at KfW, noted:
“The results of the GDA analysis provide the project with important initial indications of the project’s effectiveness. This helps us to better design future phases of the project. The analysis also showed us ways to improve our project monitoring with EO data analysis which we plan to further include in our monitoring systems. Although the results need to be compared with ground truth data, they provide a good basis for really being able to measure outcomes and impact at scale. We are, therefore, very grateful for the fruitful collaboration with the consortium implementing the study and ESA for providing the facility to do this.”
As Franziska Kaguembèga-Müller, TSV at KfW noted:
“The collaboration has shown how satellite-based monitoring can transform our understanding of landscape dynamics in Madagascar. By combining high-resolution Earth Observation data with local expertise, we now have robust and scalable insights into fire dynamics, reforestation progress and biomass development across PLAE regions. This enables us to detect risks earlier, track the effectiveness of interventions and make more informed decisions for future project phases. It marks an important step toward more effective, evidence-based natural resource management.”
First insights into PLAE effectiveness
The EO services delivered initial insights that can inform strategic planning. Fire detection maps identified high risk regions such as Betsiboka, Boeny and Sofia and provided indications of the effectiveness of fire prevention measures. Reforestation monitoring revealed strong vegetation recovery in some areas and limited growth in others, allowing institutions to examine underlying causes. Biomass estimates indicated a general increase in forest carbon stocks, supporting the exploration of carbon certification mechanisms.
Path forward: embedding EO in the PLAE Programme
This collaboration shows how EO can be systematically embedded into International Financial Institution operations, aligning with the mission of GDA to mainstream satellite data in sustainable development. EO based monitoring integrated into PLAE strengthens long-term tracking of reforestation outcomes, fire risks and carbon sequestration.
ESA and its service providers are exploring opportunities to scale the services further, including near real-time updates, online data access platforms and capacity building for local partners. Integrating additional data sources and data science techniques could also help refine assessments and explain the drivers of plantation performance.
The project’s outcomes were presented by CLS and WfS during the EEA and ESA conference “EO for Monitoring, Reporting and Verification of Carbon Removals” in October 2025.