


In a world of complexity, fast-paced policy cycles and information overload, how can Earth Observation (EO) communications cut through the noise and actually drive action?That was the focus of ESA’s latest Global Development Assistance (GDA) webinar on interactive communications, hosted by Caribou and supported by Evenflow. From interactive dashboards to immersive evaluation tools and on-demand content libraries, the event showcased how the GDA programme is rethinking science storytelling.
Making EO understandable, usable, and impactful
Opening the session, Fabio Cian (ESA’s Representative to the World Bank) set the scene with an overview of how the GDA programme has evolved. From awareness-raising in EO4SD, to mainstreaming EO into IFI operations under GDA and the upcoming transition of GDA under the Earth Action programme.
Then, two examples of that mission in action:
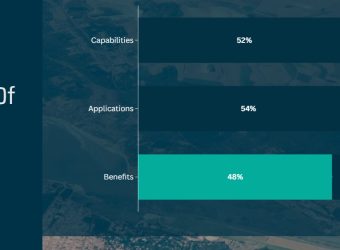
Giulia Costella (Caribou) shared how interactive formats are helping evaluation and M&E results land more effectively, with examples like the interactive Mid-Term Evaluation and the GDA Impact Dashboard, and the Transport & Infrastructure interactive page, which uses a narrative format to make EO insights more accessible and engaging.
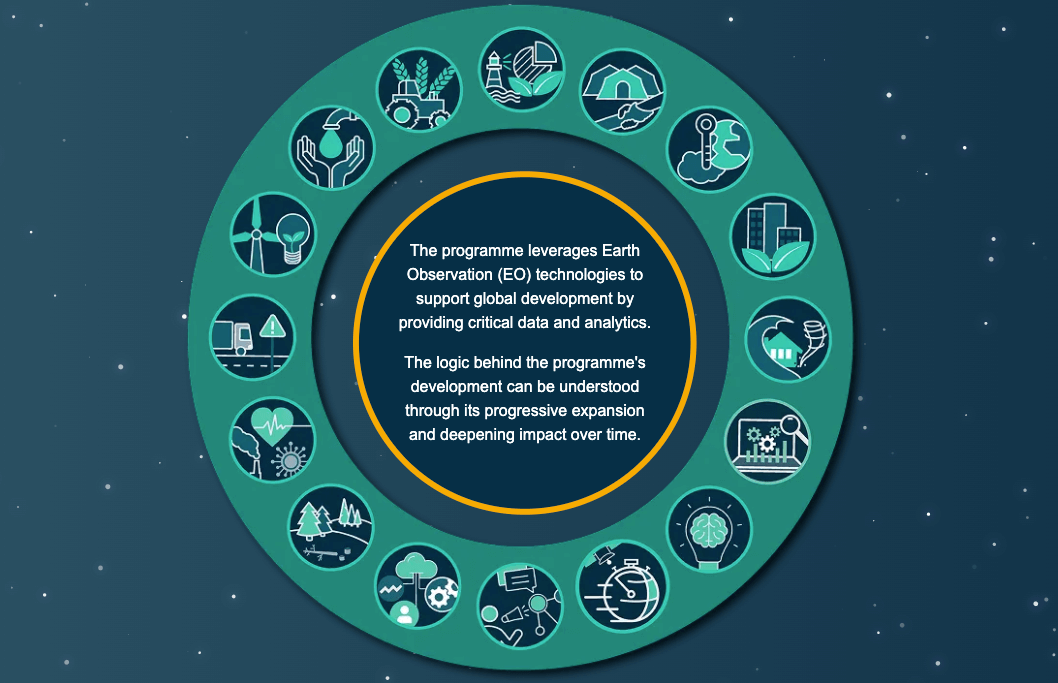
Thomas Willems (Evenflow) presented the GDA Communications (CCC) strategy. With tools like the Impact Sphere, Impact Newsroom, interactive infographic and animation library, the CCC builds content that’s not only easy to understand but easy to reuse. Whether you’re a task team drafting a report or a policymaker preparing a presentation, “GDA content is designed to be lifted straight into your workflow,” Thomas noted.
Key takeaways
- Interactivity drives accessibility: By letting users explore what matters to them, interactive tools reach wider, more diverse audiences.
- EO must be action-ready: From scroll-friendly animations to clickable case studies, content needs to bridge the gap between data and decisions.
- Iterate to improve: GDA tracks what works. If a graphic resonates, it gets elevated; if a section goes unread, it gets revised.
Missed it? A recording of the session can be found below.
Want more? Explore the interactive outputs discussed:
- GDA Interactive Evaluation
- GDA Transport & Infrastructure Interactive Video”
- GDA Transport & Infrastructure Thematic Page (available soon)
- GDA Impact Dashboard
- GDA Impact Sphere
- GDA interactive infographic
- GDA animations